I Made A Real-Time Build Visualizer
August 13, 2025・6 minute read
Here it is showing the build of a macOS app:
Before I explain what you’re looking at, here’s some background:
Sometimes software takes a long time to compile just due to how much code it has, like in the LLVM project. But often a build is slower than it could be for dumb, fixable reasons. I’ve had the suspicion that most builds are doing dumb stuff, but I had no way to see it. So I’ve been working on a cross-platform tool to help visualize builds (In private beta, see below). It works with any build system and any programming language (Not just C/C++/Rust).
It’s more than just a generic system profiler: it looks for build-specific problems. A few examples: using make without the -j flag, disproportionate time being spent on certain files or compiler phases (as reported by tools like clang’s -ftime-trace), and commands that could’ve been run in parallel but weren’t. It’s especially helpful for optimizing CI builds, which are often clean rebuilds.
I named it What the Fork after the fork() system call that spawns new processes. You use it by writing wtf before a build command:
$ # A few possible examples:
$ wtf make
$ wtf cargo build
$ wtf gradle build
$ wtf npm run build
$ wtf zig build
$ wtf -x # starts a build of the front most Xcode window
And that launches the UI, which updates as the build progresses.
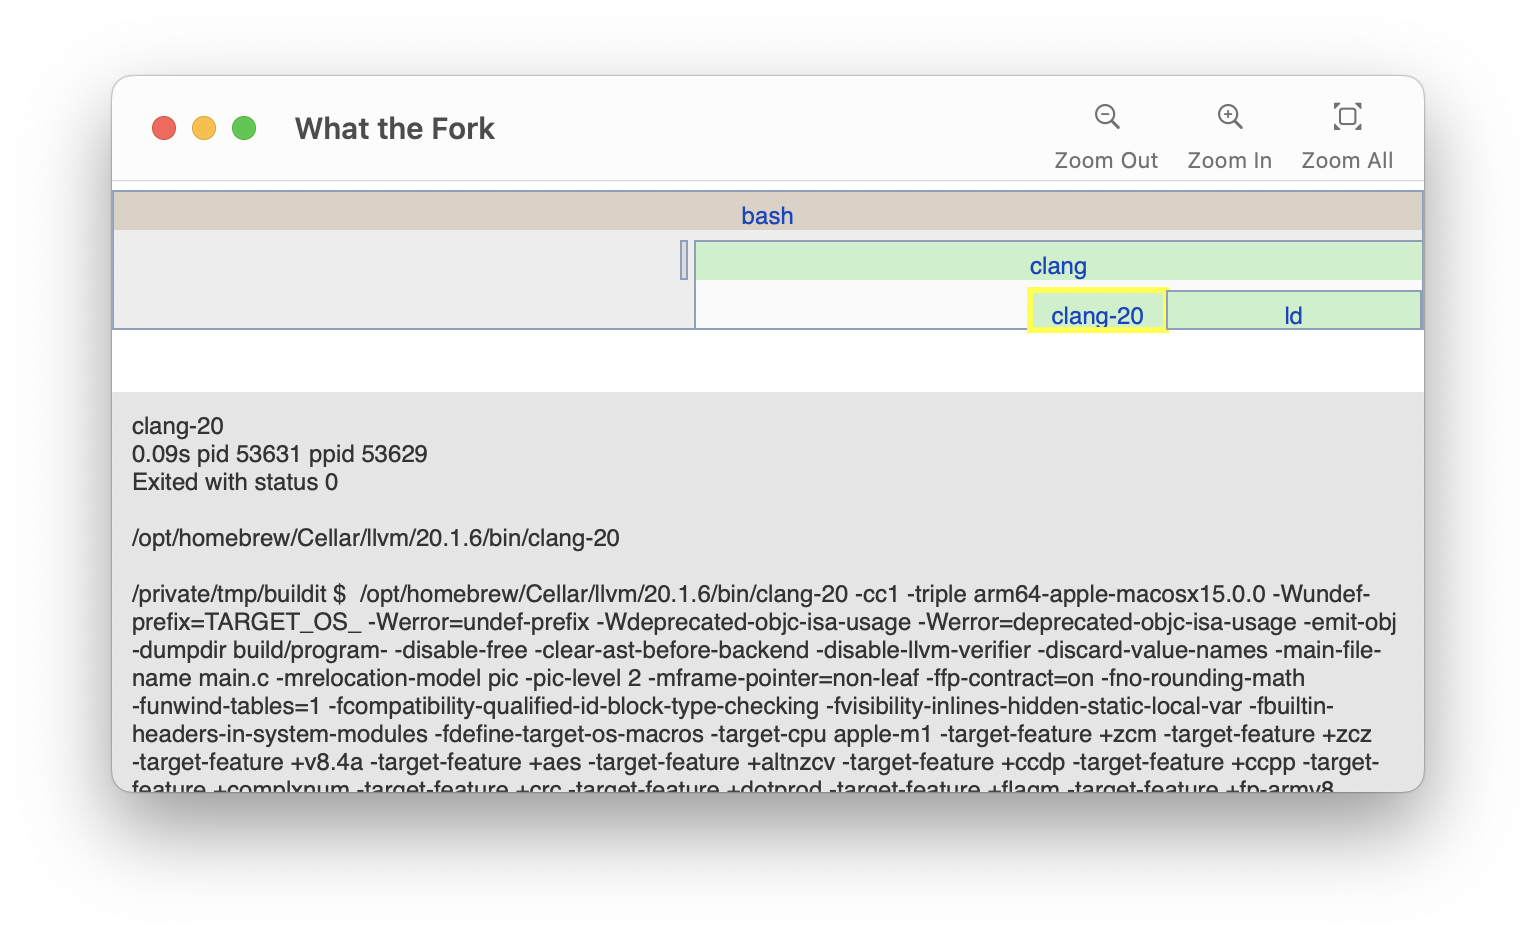
The UI shows each process in a build represented as a box, colored according to its type. The processes are laid out in timeline order from left to right. Child processes are shown nested below their parent. The panel at the bottom of the window shows information about the selected process: how long it ran, the working directory, and the full command with arguments.
How it works
A build is just a bunch of commands that produce your finished program. At its simplest, it could be a shell script like this:
#!/bin/bash
clang main.c -o program
That script requires 3 programs to produce the final result: bash, clang, and — surprise! — ld, the linker, which clang runs automatically. Unexpected build steps are often the source of slowdowns and are even more likely in bigger projects, which often use something like cargo, make, bazel, gradle, or xcodebuild instead of a shell script. Those tools still just execute commands, but they also perform caching, dependency analysis, and scheduling to do the least amount of work as efficiently as possible.
While it is possible to see commands run by a build tool in the terminal output, that doesn’t tell you what commands those commands run (like clang running ld) and doesn’t include detailed timing! So if we want to see everything a build does, we need to listen for the system calls that start and terminate processes: fork, exec, and exit. Each operating system has a its own way to do that:
- macOS has the Endpoint Security API
- Linux has
ptrace() - Windows has the “Worst API Ever Made”: Event Tracing for Windows
Each of those API are a pain to use for different reasons, but they do provide the information required to reconstruct a timeline. Here is our simple shell script’s execution visualized in the macOS version of What the Fork.
Keen readers will have noticed that these techniques allow the app to be used on any type of program that launches sub-processes - not just builds! If you have any ideas for how that might be useful outside of build optimization, let me know.
Things I’ve Noticed
Being able to see your build reveals a lot. I’ve had engineers from Delta, Mozilla, and Apple try the tool on their projects and each one found something unexpected. Let me give you some examples.
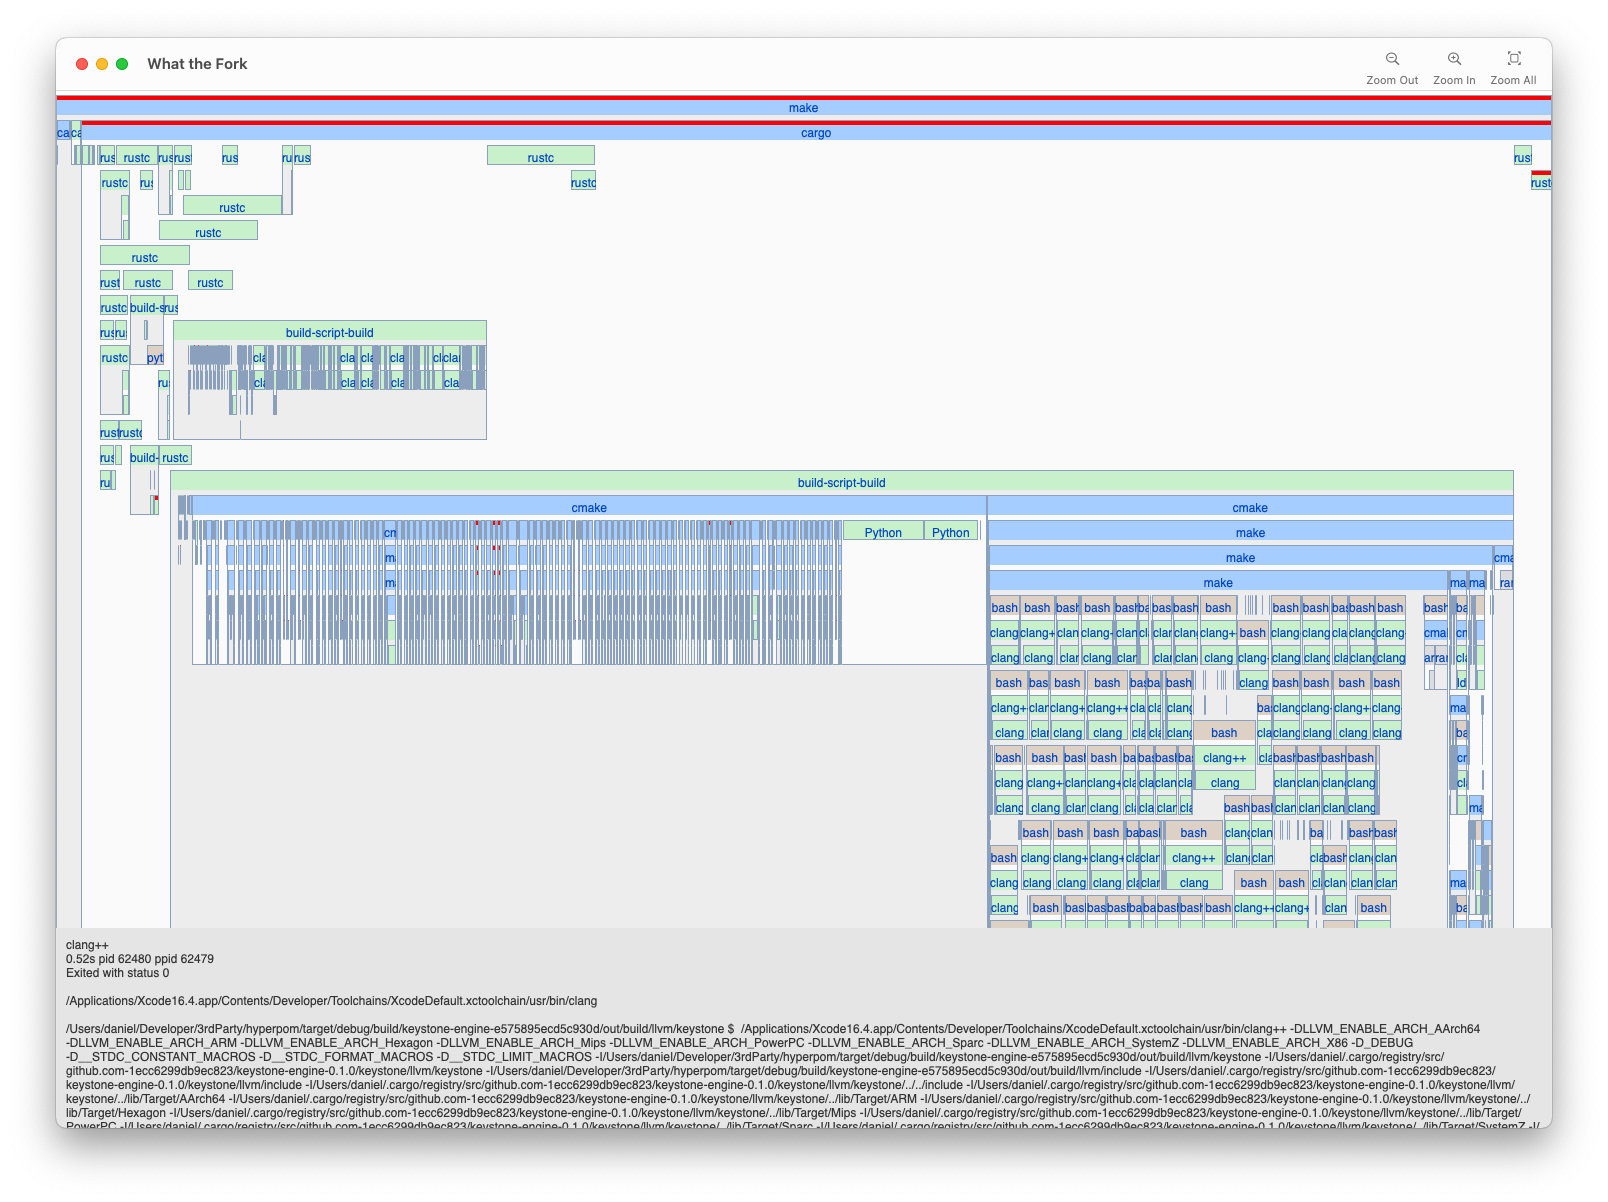
I’ll start with an open source project that uses cargo to build. I’m going to zoom in on the compilation of a single dependency:
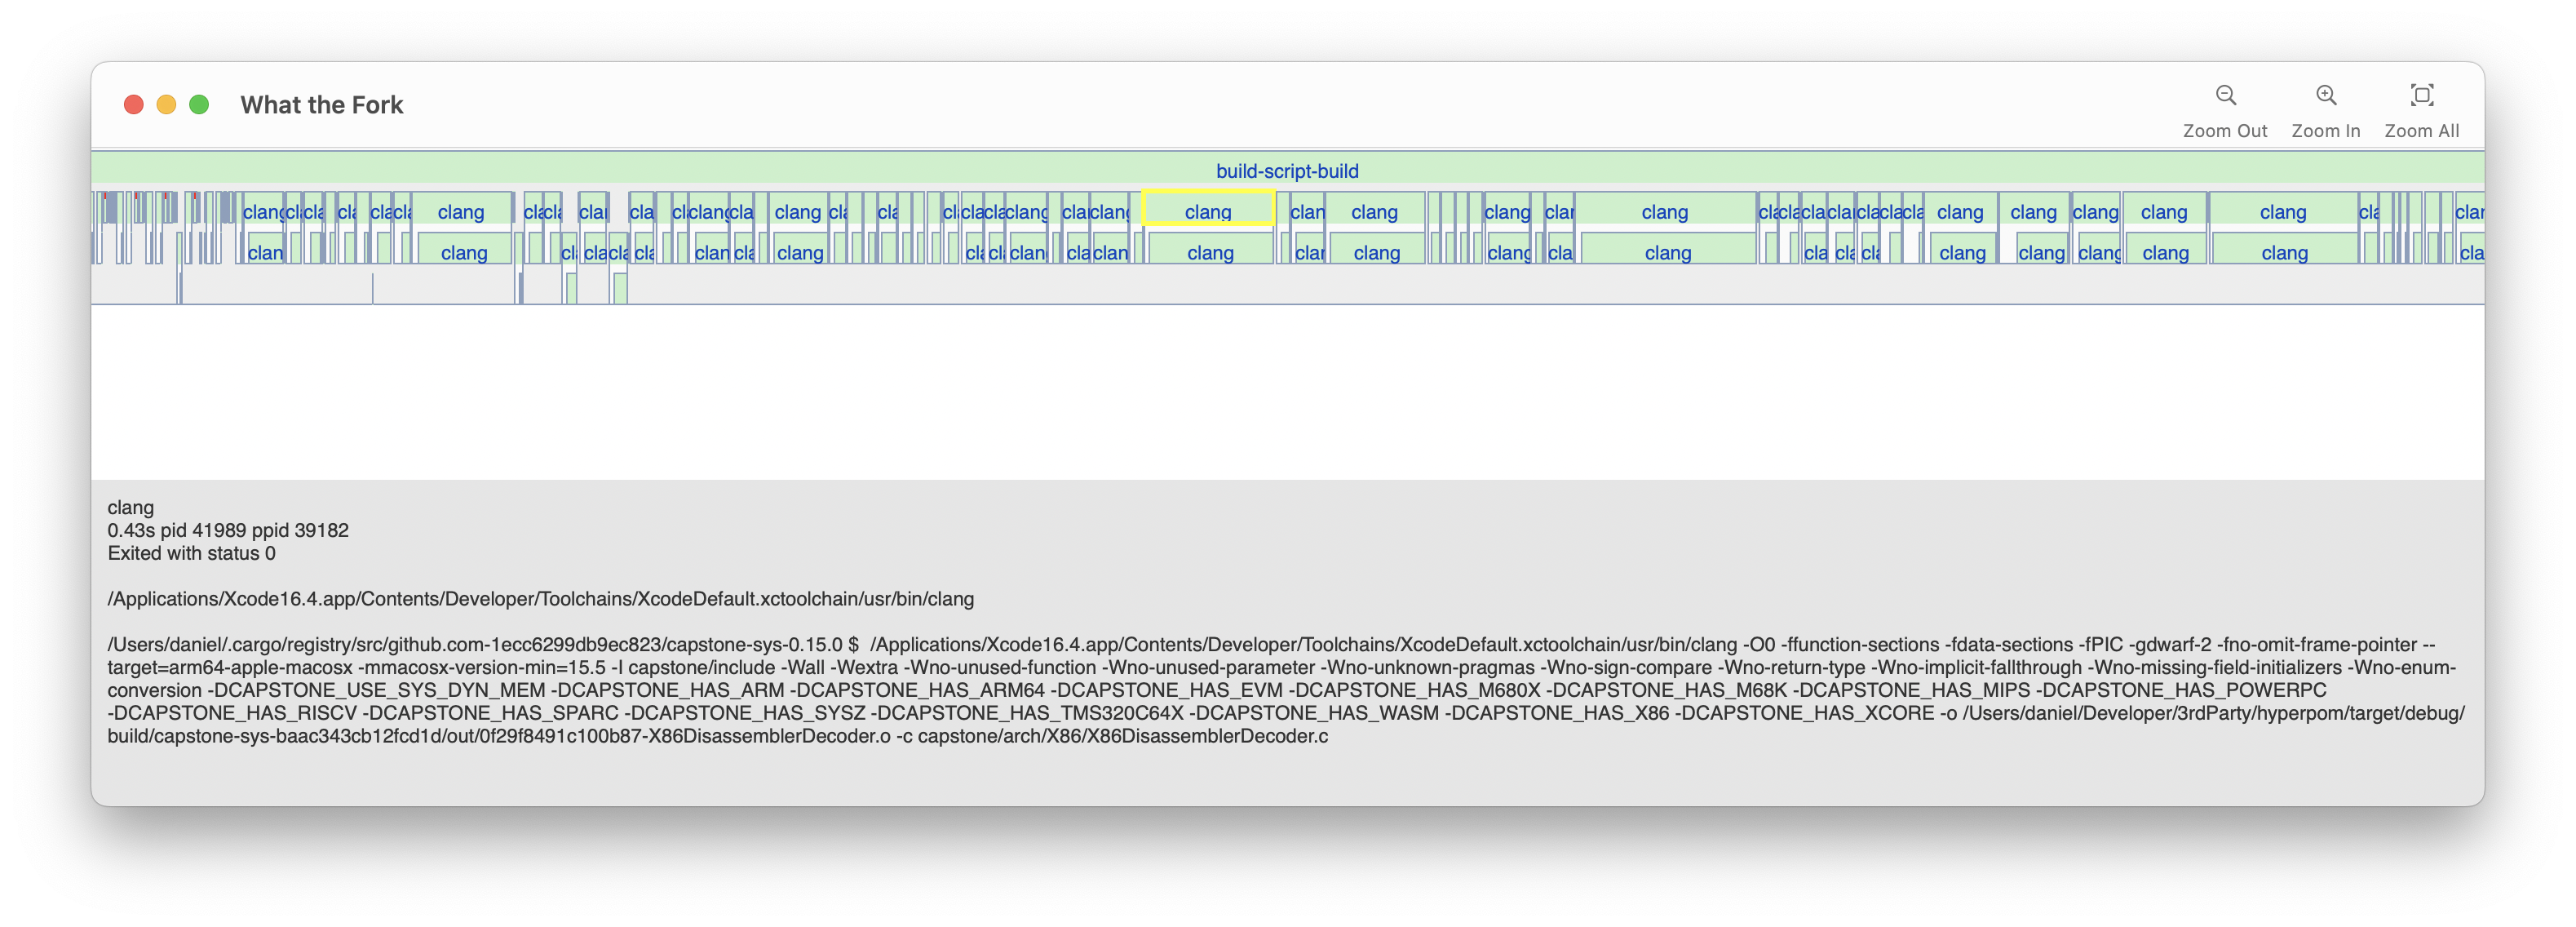
Oops! No parallelism! Files are compiled one at a time. It could be about 10 times faster if cargo ran multiple commands at once on my 10 core M1 CPU. I’d have never noticed this without a timeline visualization. If you want to see what good parallelism looks like, check out how ninja builds the llvm project:
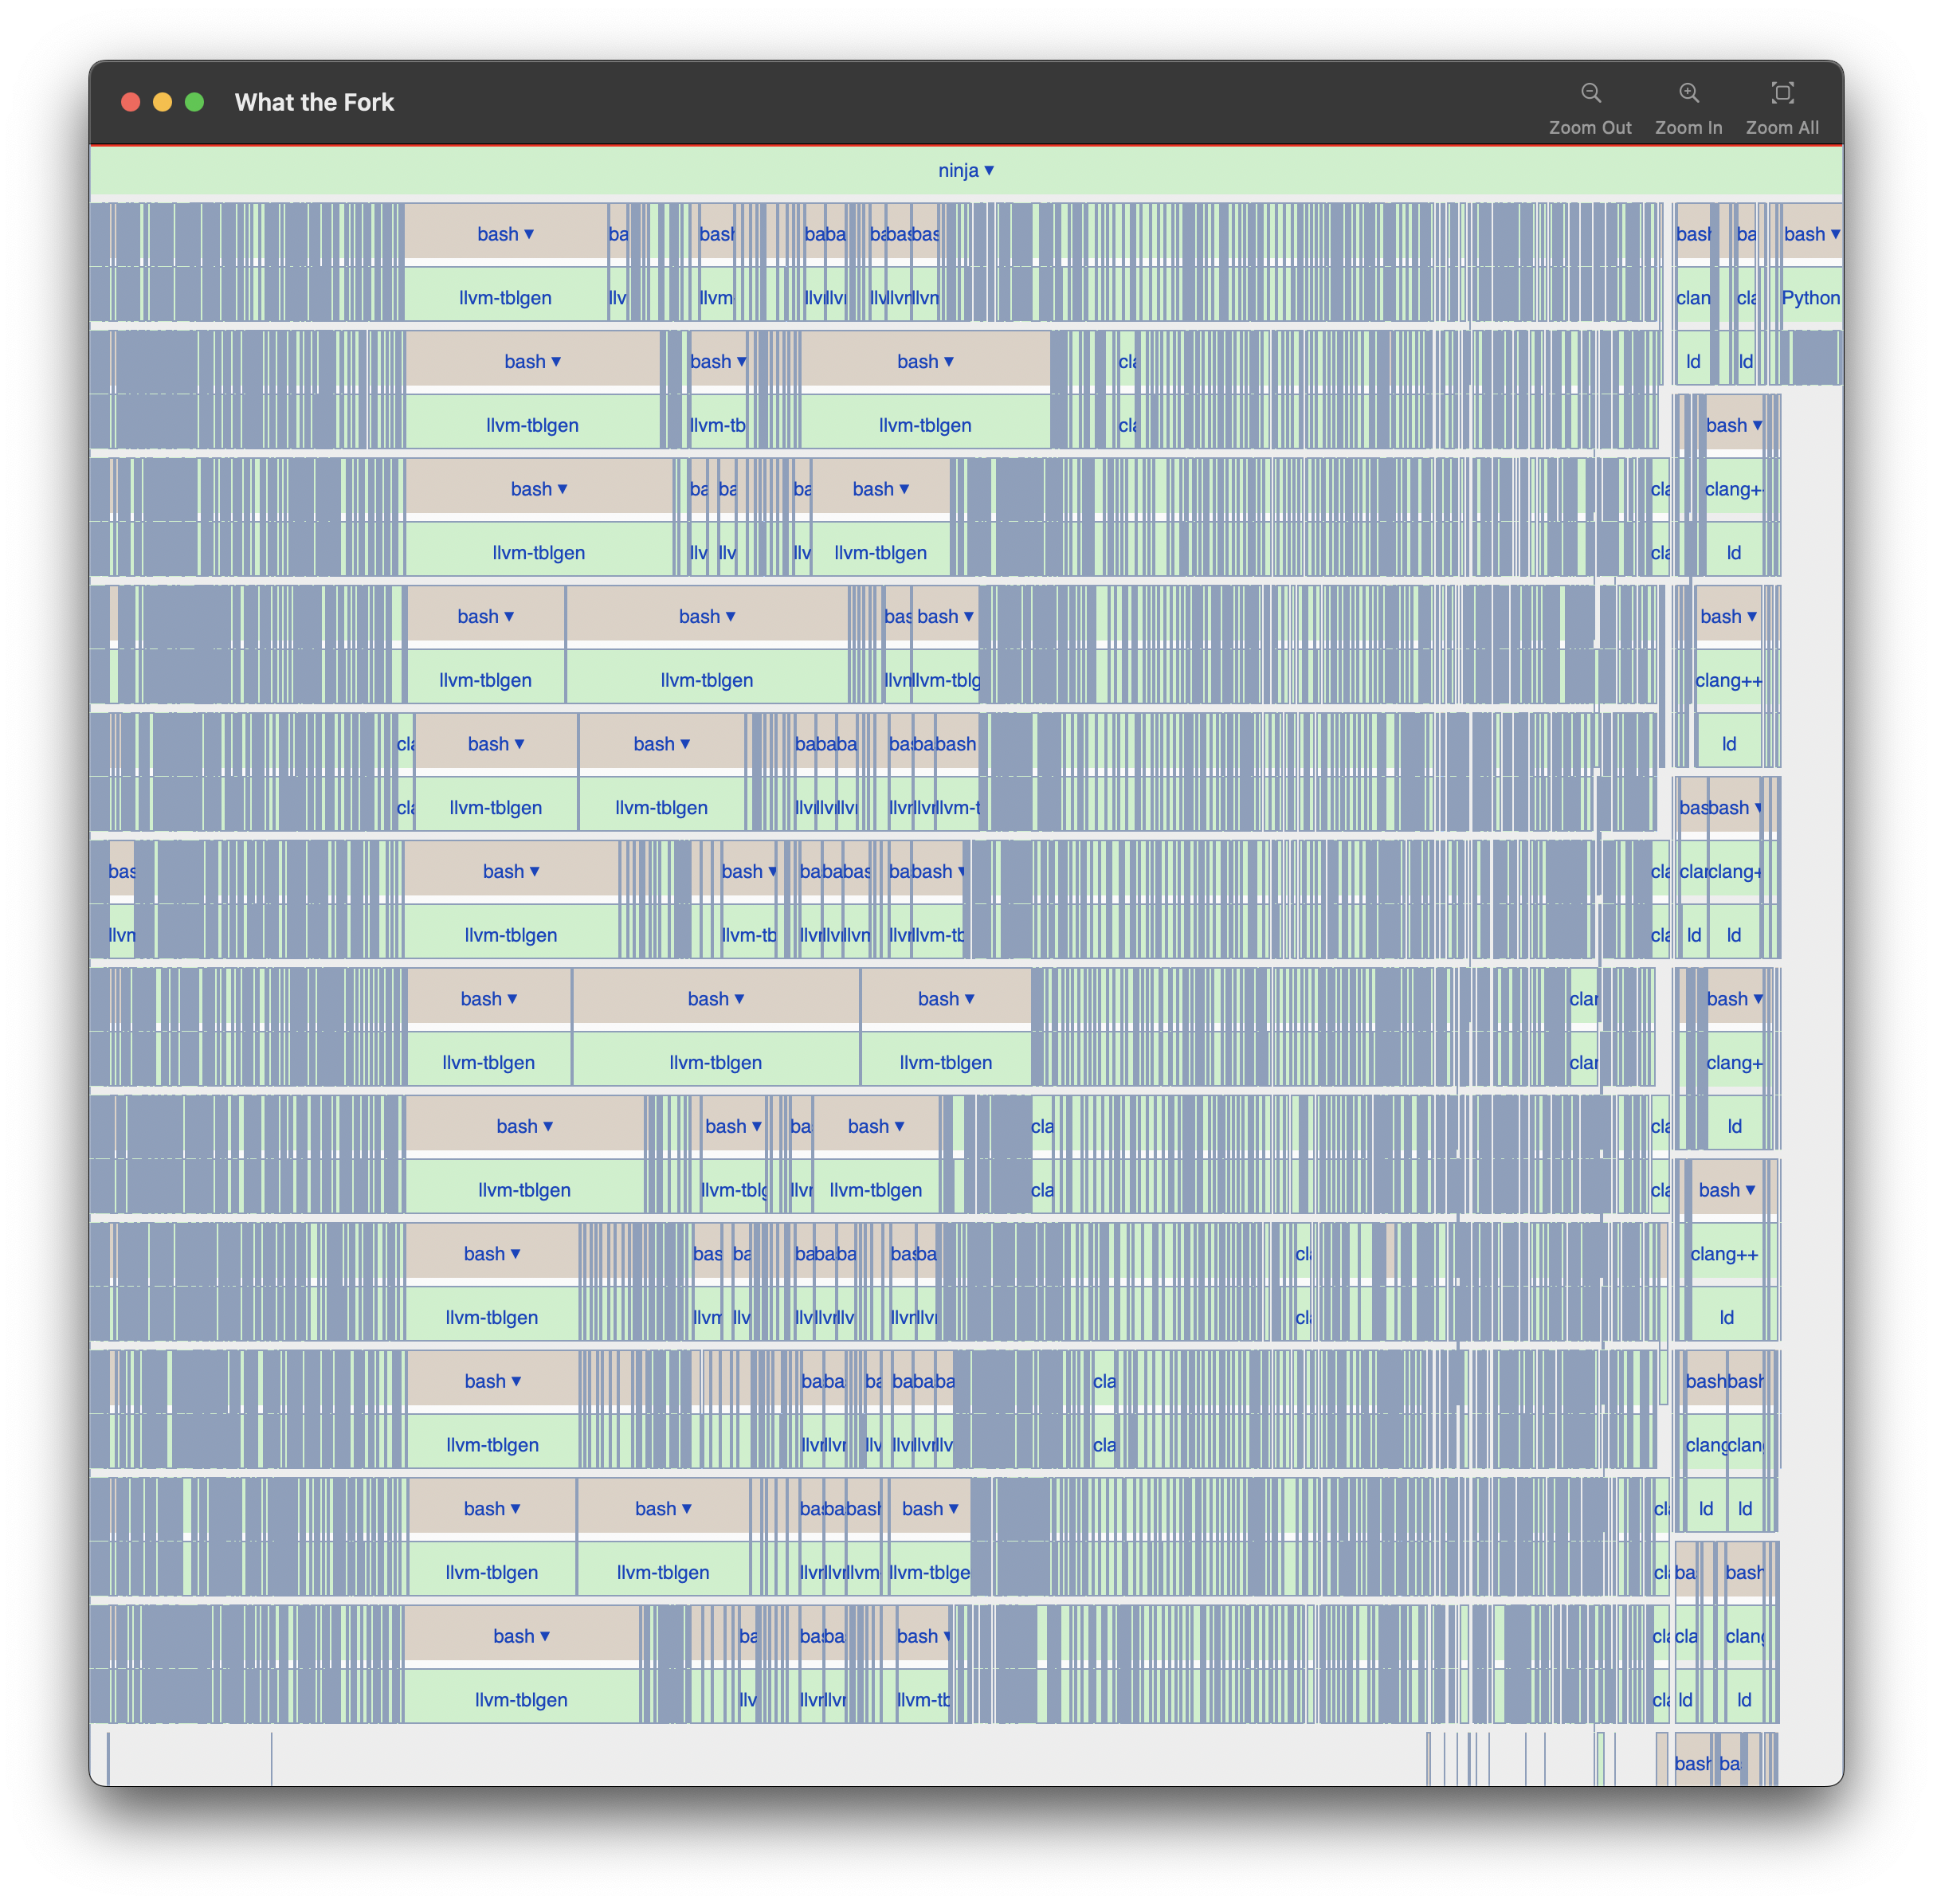
Every core of my machine is kept busy the entire time. It’s actually slightly over-subscribed with 12 jobs in flight on my 10 core machine, which is intentional in case some jobs are blocked on IO. Perfection. Perfect is boring though, lets look at a problem. Here’s a tiny slice of a CMake build from another open source project:
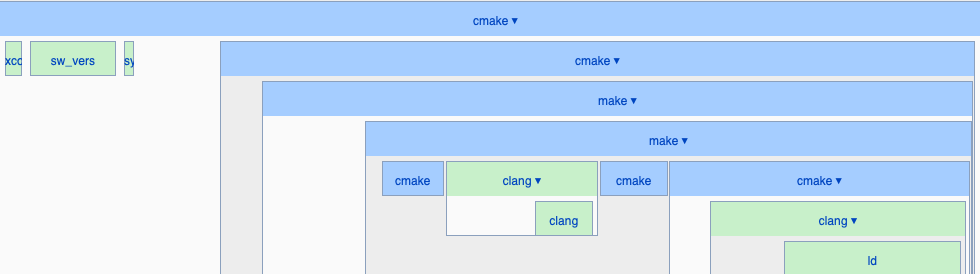
Here CMake gets Xcode’s path with xcode-select -print-path, the OS version with sw_vers, and then recursively calls cmake/make a few times for good measure, and finally compiles and links a file.
Only the green boxes in that timeline are doing useful work. One could argue that none of what CMake does is “useful work”, in the sense that it just builds the thing that actually builds the project. Regardless, let’s just accept that CMake needs to do this weird cmake->make->make->clang dance to figure out the build environment.
Zooming out reveals that the weird dance happens 85 times!
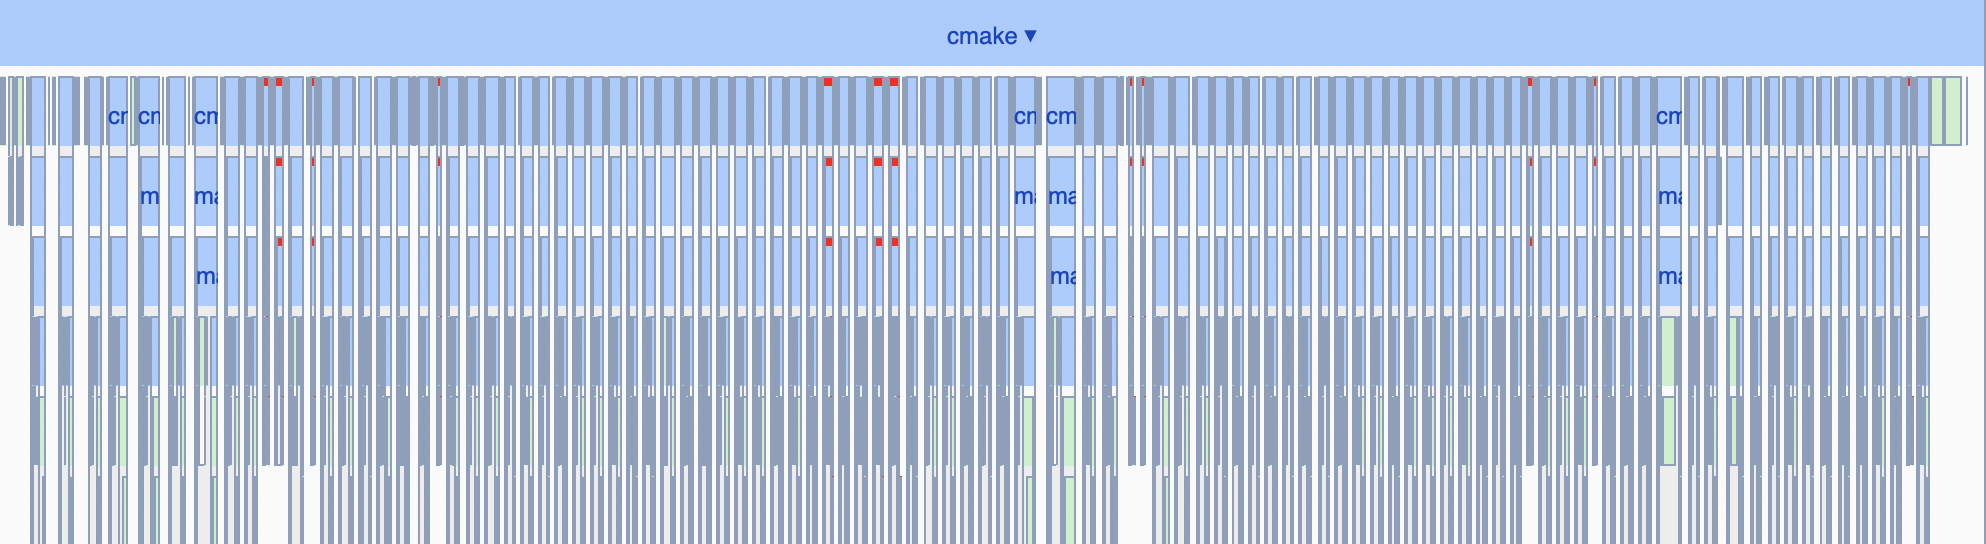
Yikes, no parallelism. It also studiously re-checks the Xcode path and OS version 85 times, just in case the OS version changes mid-build.
Ok enough about cmake. There are other builds to explore! Here’s xcodebuild building a 100,000 line Objective-C project:
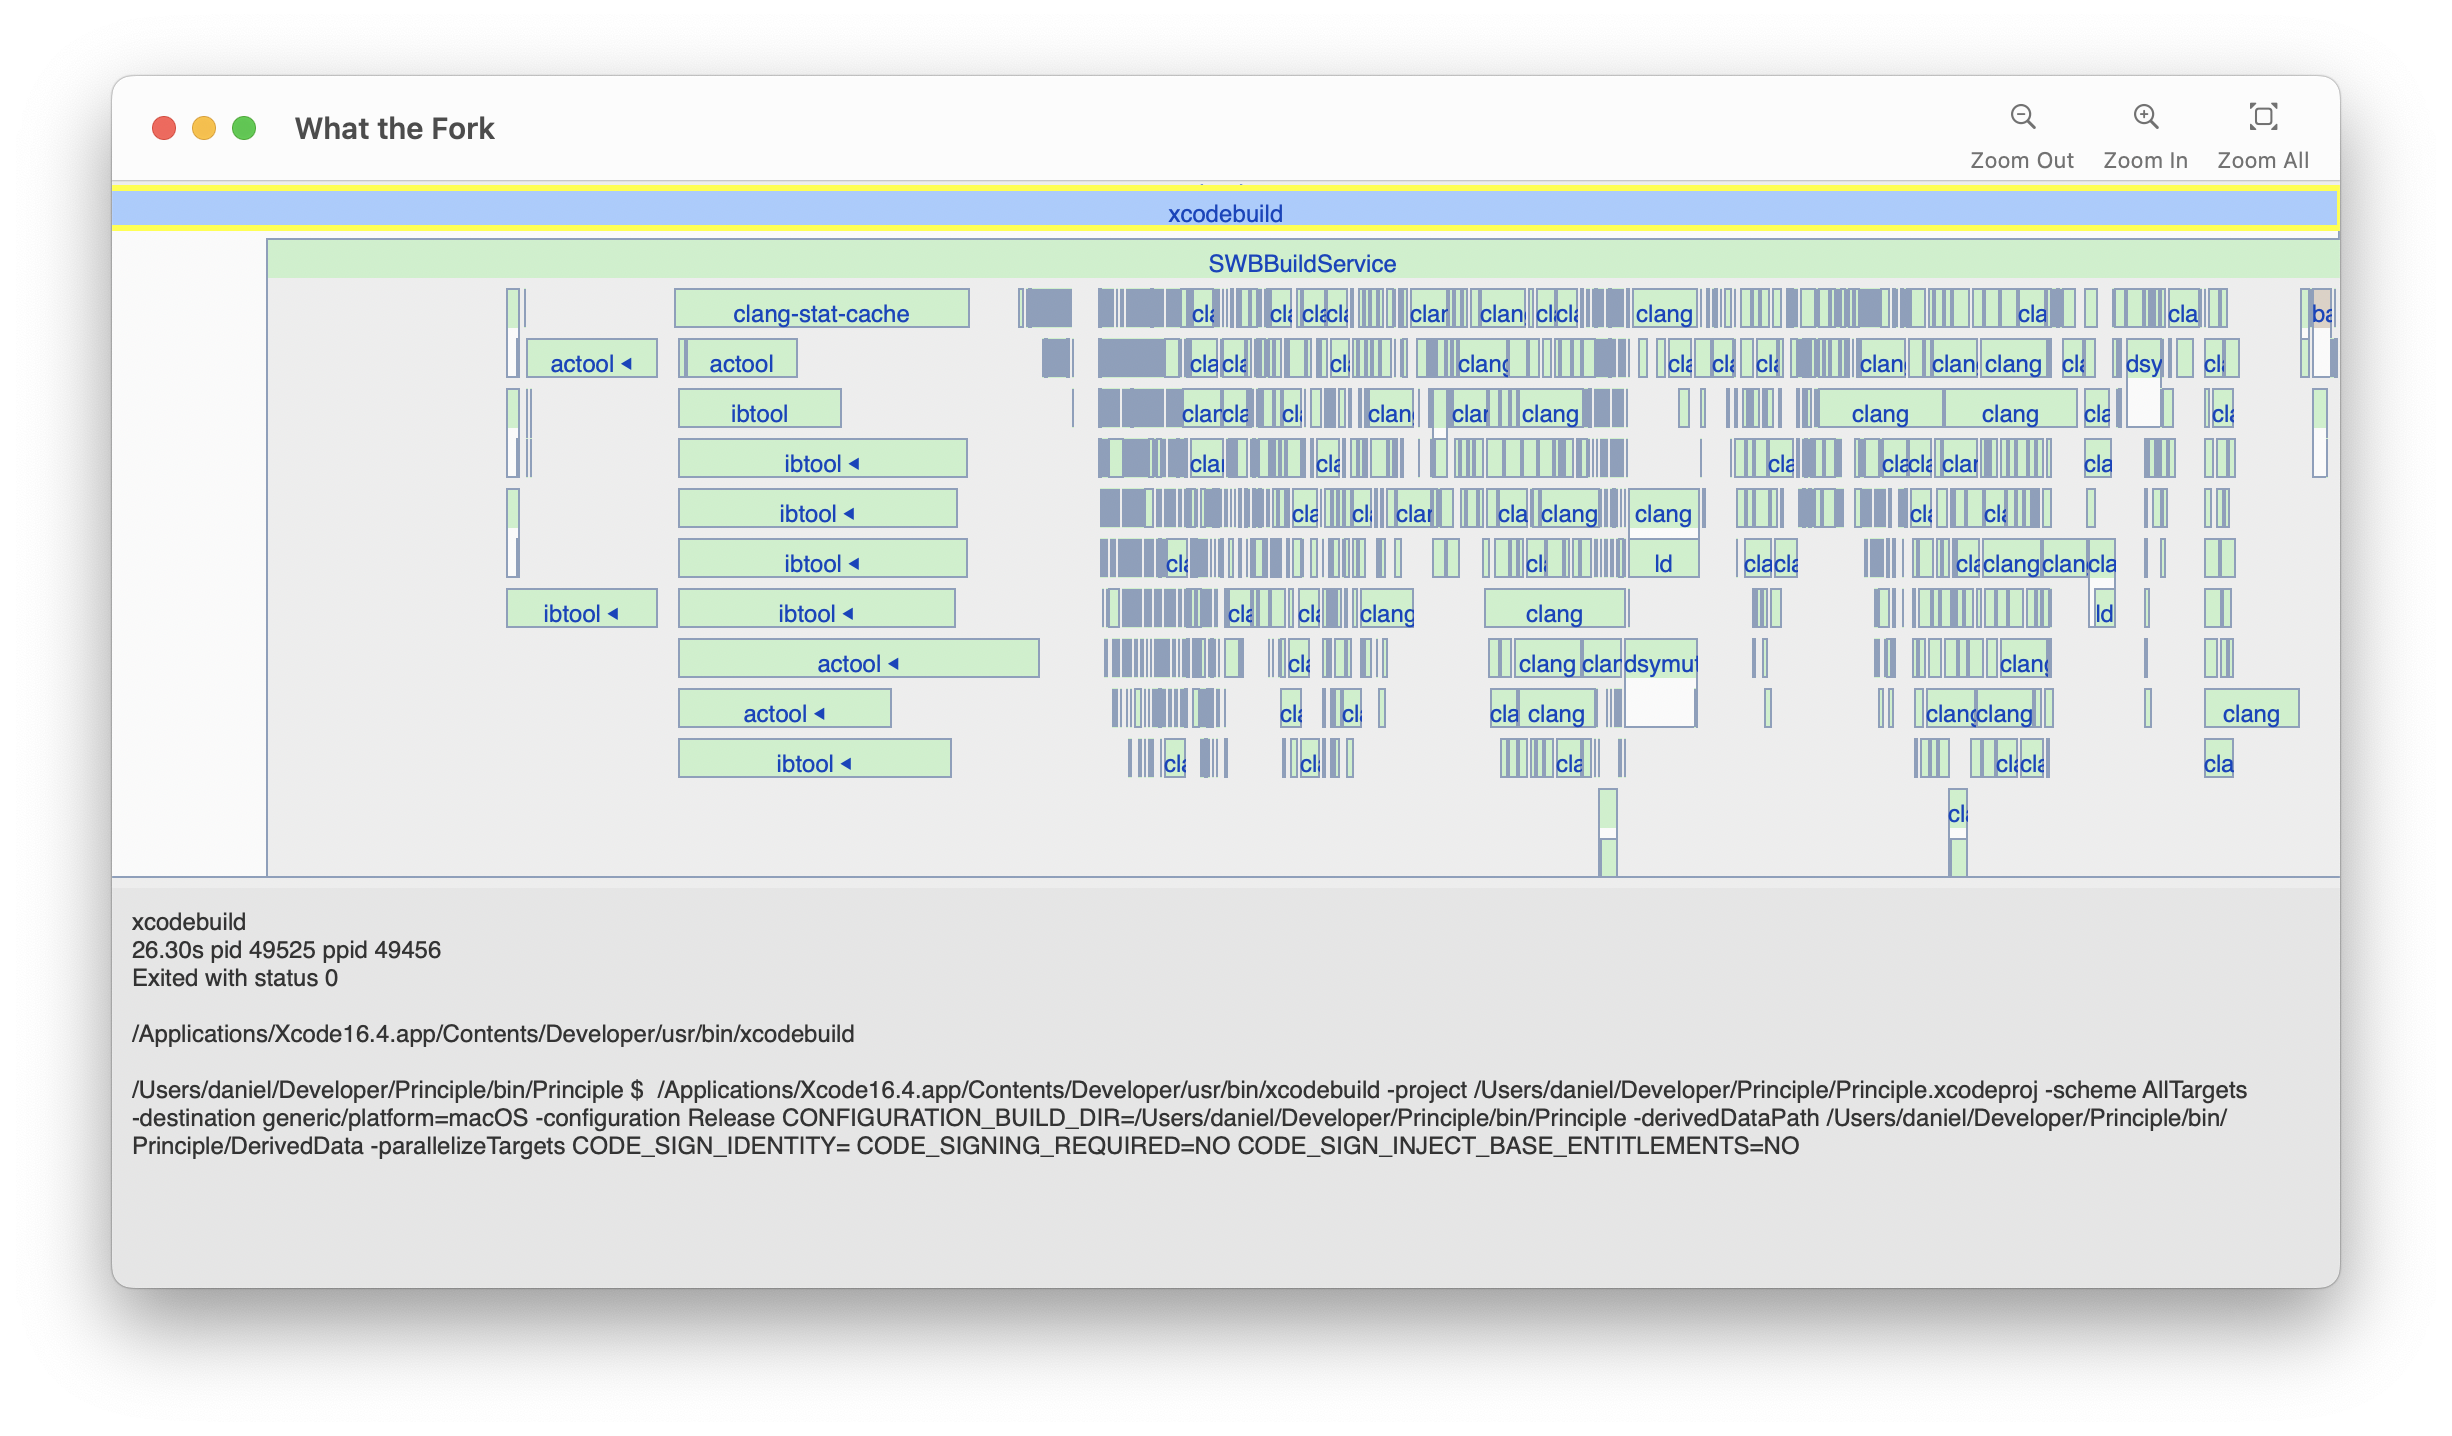
Notice how it has gaps towards the end of the build where it only has one or two clang processes running, even when there is a lot more to do.
It also has 6 seconds of inactivity before starting any useful work. For comparison, ninja takes 0.4 seconds to start compiling the 2,468,083 line llvm project. Ninja is not a 100% fair comparison to other tools, because it benefits from some “baked in” build logic by the tool that created the ninja file, but I think it’s a reasonable “speed of light” performance benchmark for build systems.
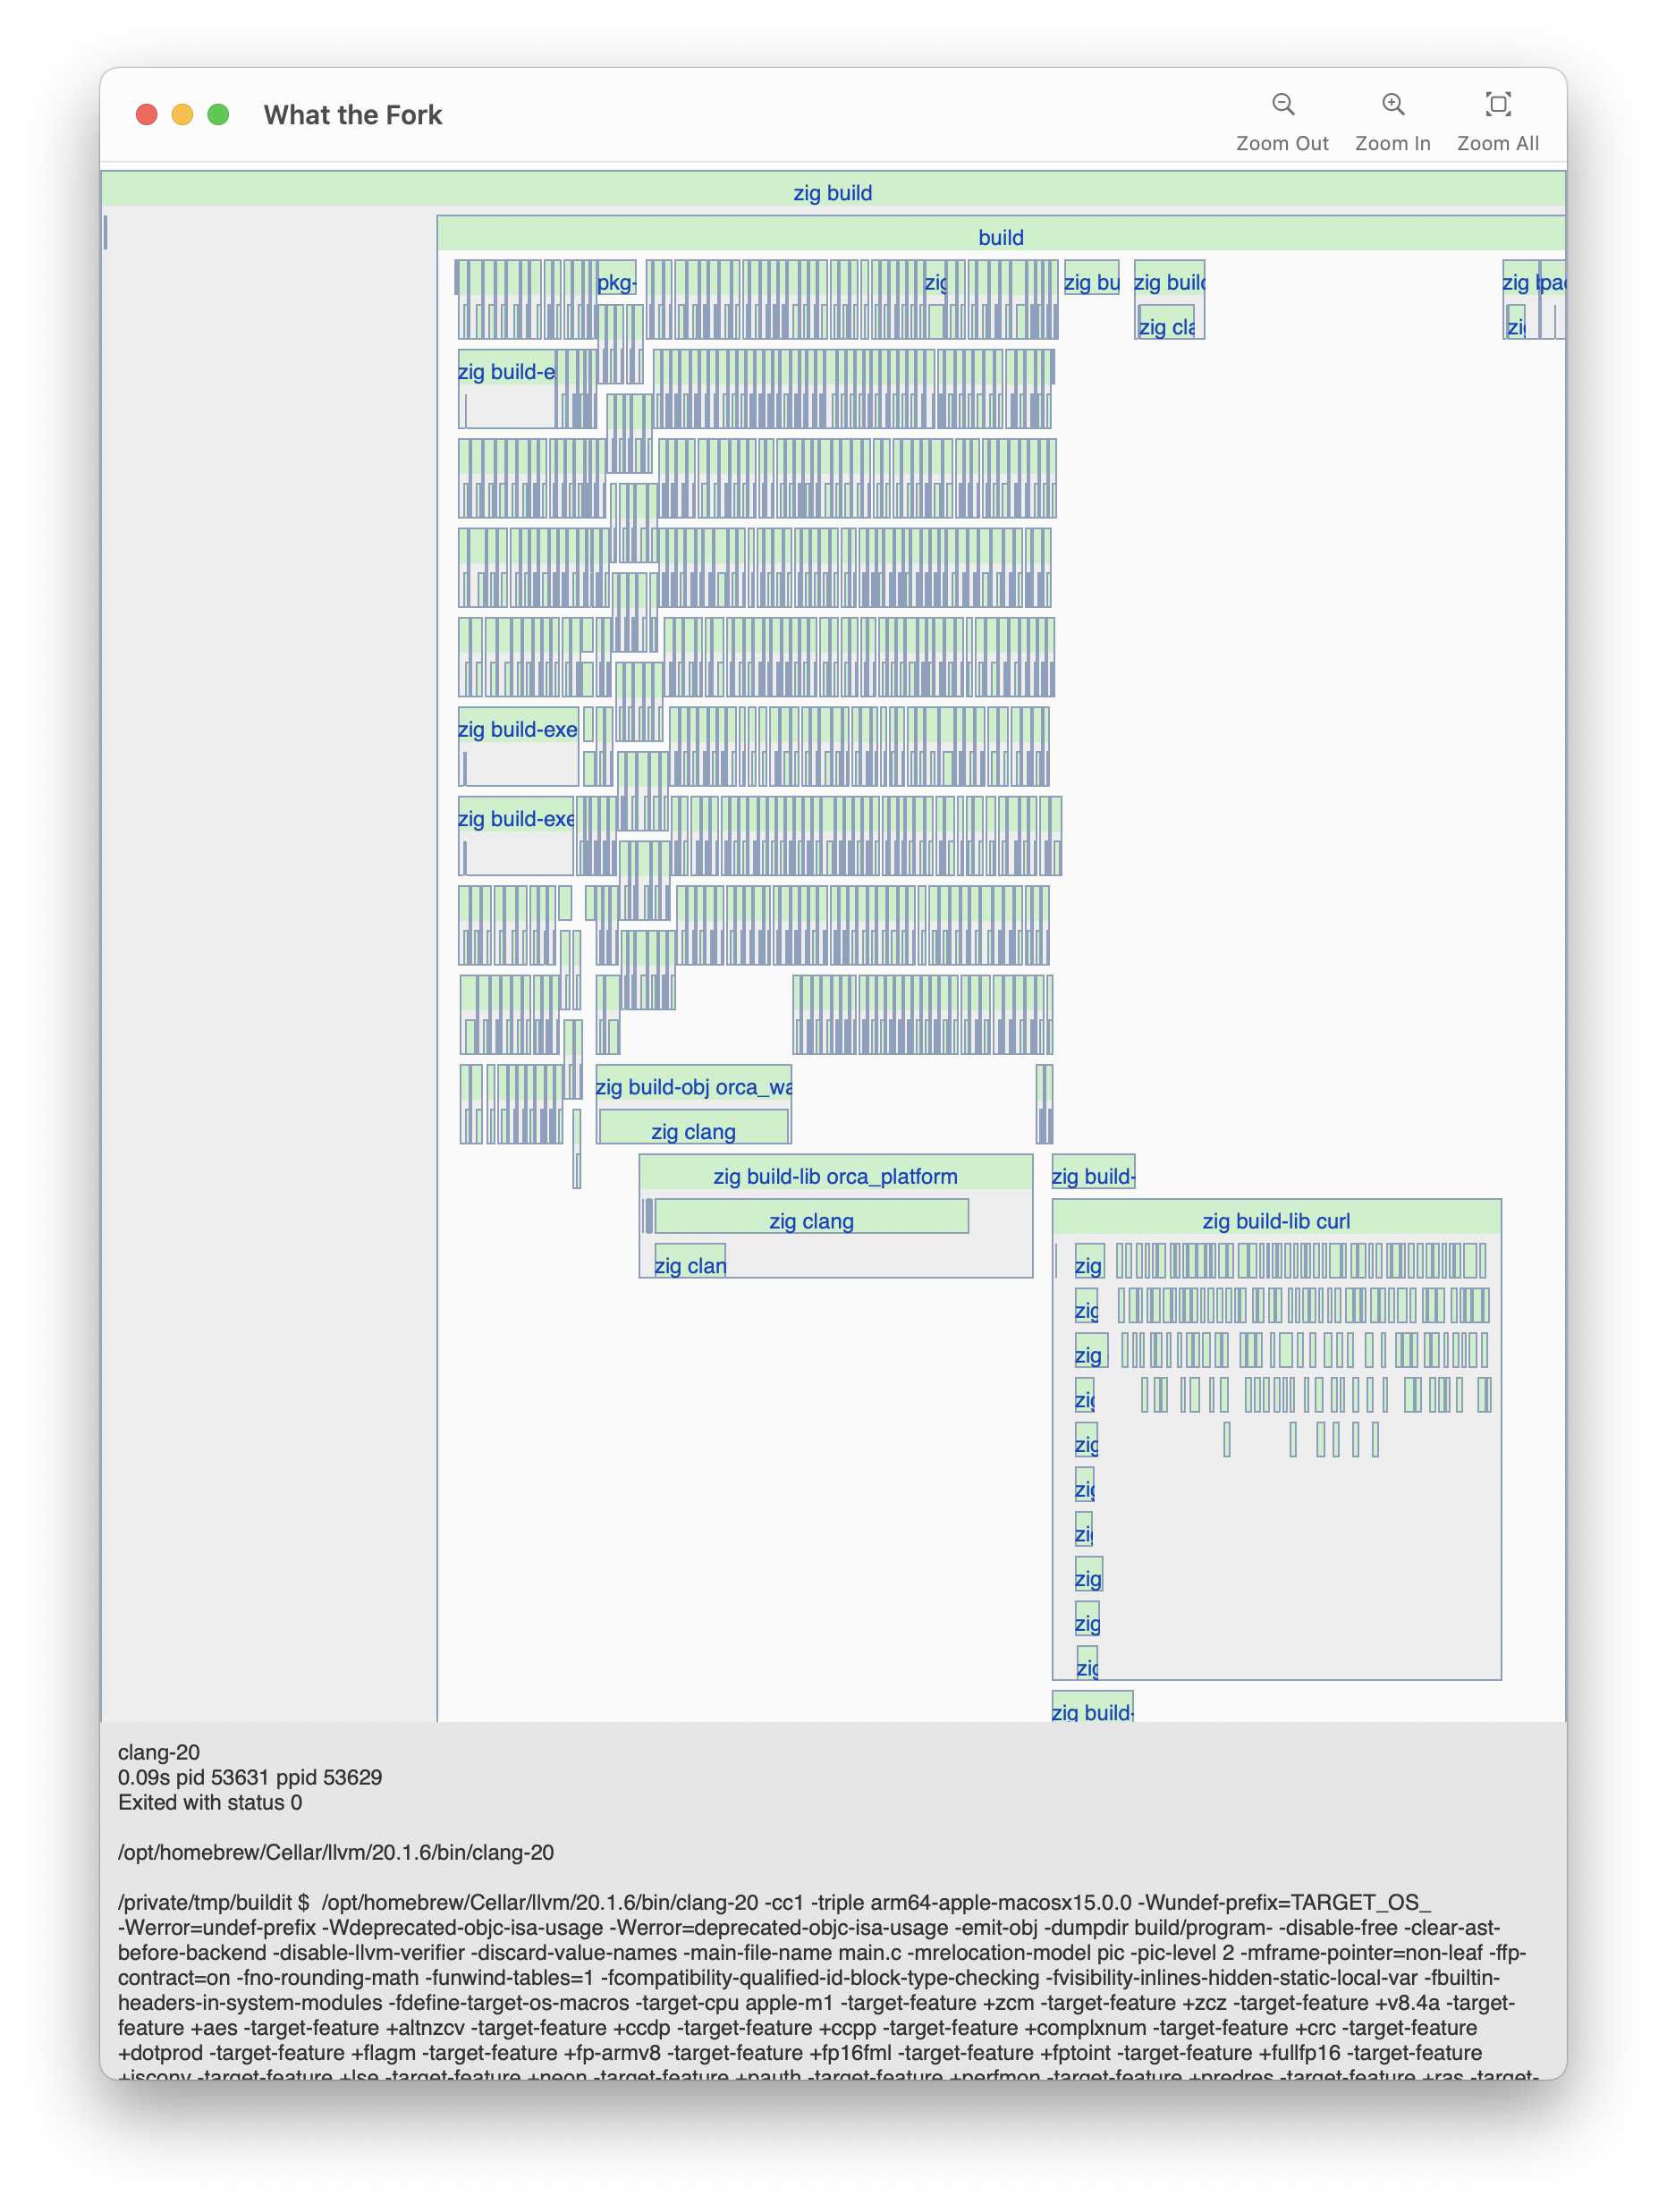
Continuing our tour of various builds, here’s Zig compiling the Orca Project:
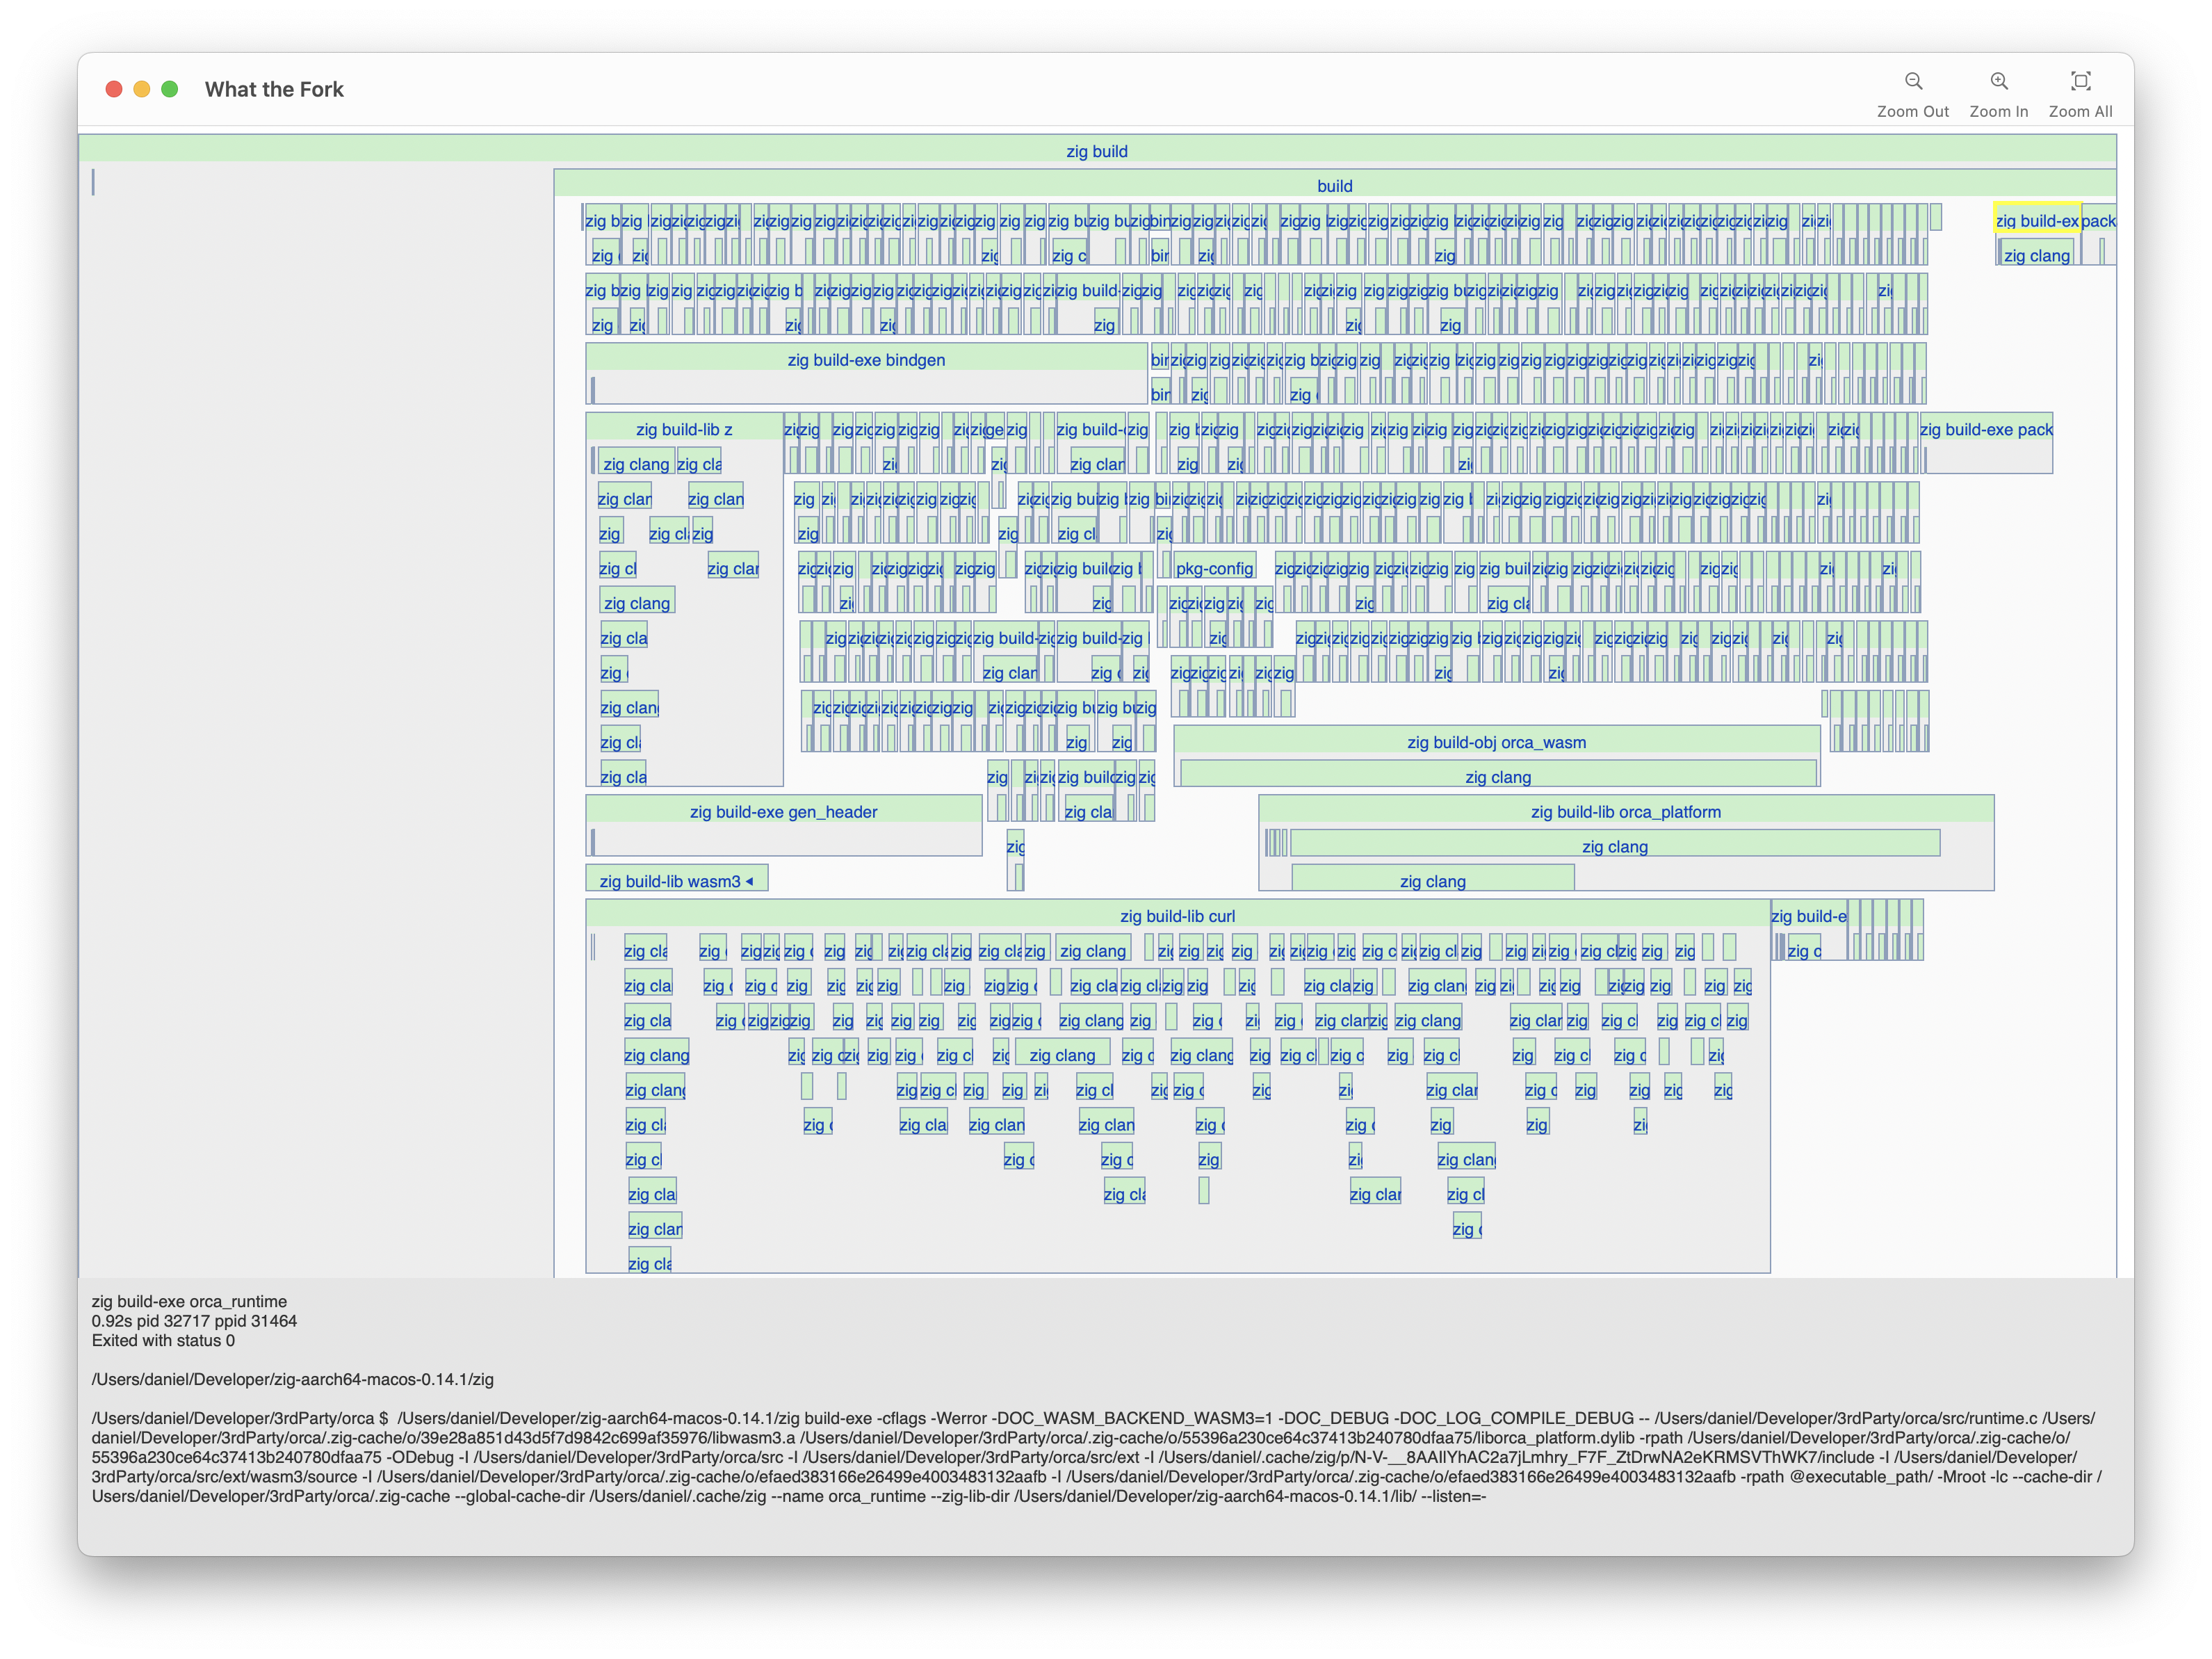
What’s interesting here is that zig build builds dependencies in a random order (To expose ordering problems due to misconfigured builds). That means that sometimes it gets lucky with the ordering, like in the previous image where it’s fast. But sometimes it’s unlucky, like below where the curl dependency got scheduled at the verrrry end, so it doesn’t have any parallelism with the rest of the project:
And finally, here’s make/go compiling the github cli project:
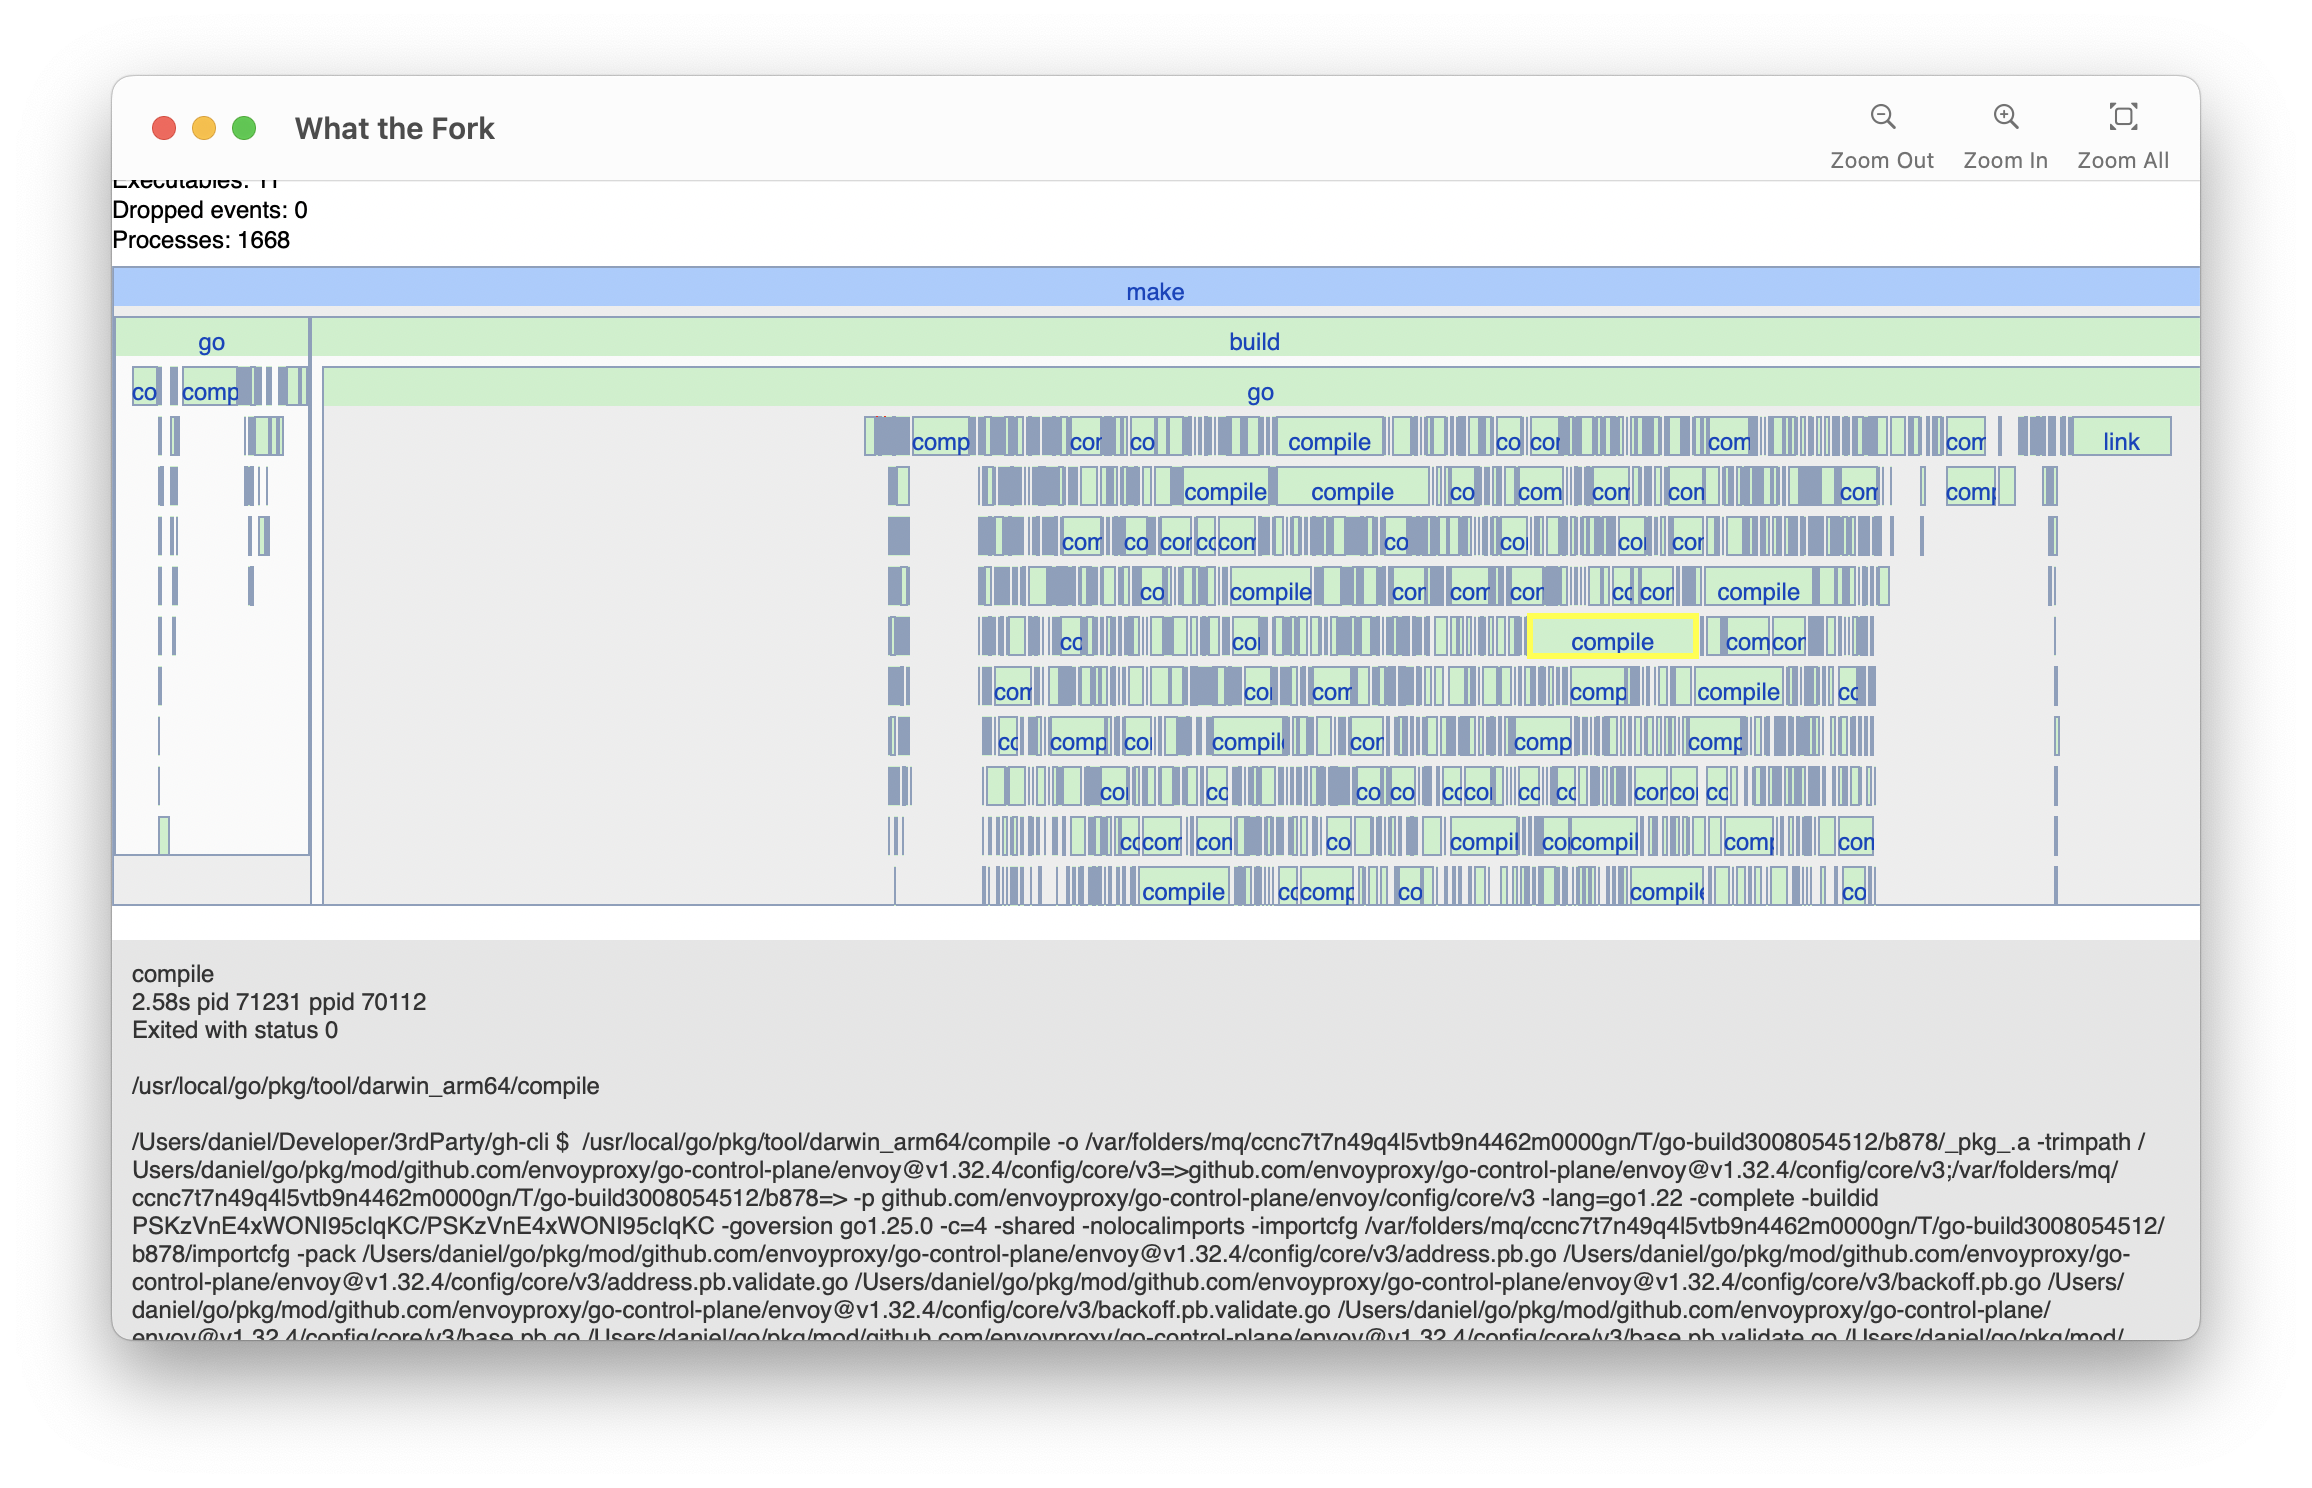
That big blank area towards the left is all the project’s dependencies being downloaded, so if I wanted to speed up this project’s clean builds, I’d focus on reducing dependencies first. Dependencies are kind of a build-double-whammy because guess what those long “compile” commands are: the dependencies go-control-plane, protobuf, gojq, etc.
That’s just a sampling of the things I’ve learned by visualizing builds. Of course there are more nuanced issues you can find by looking at a process’s full command, but today I wanted to focus on things that I could show visually.
Try it
What the Fork runs on Windows, Linux, and macOS. If you’d like to join the early access, email me with the following information:
- Which operating system you build on (so I can send you the right app version)
- What build tools it uses (cmake, make, cargo, bazel, etc)
- How long a clean build takes
My email address is daniel at this website’s domain.